Chapter 5 Evaluate T cell modulatory BAs in patients with GVHD vs controls (figure 4)
5.1 3oxoLCA
filtered_combined_table %>%
  left_join(cohort_BAS) %>%
  filter(later=="Y") %>%
  filter(ursodiol=="Y") %>%
  ggplot(aes(y=log10(dehydrolithocholic_acid+25000), x=GI_GVHD, color=GI_GVHD))+
  geom_boxplot(width=0.2, lwd=0.8, outlier.shape = NA) +
  geom_jitter(width=0.3, alpha=0.3, size=2.5)+
  ylab("log10(3oxoLCA)")+
  xlab("")+
  theme_classic()+
  stat_compare_means(comparisons=list(c("Y", "N")),
                     method="wilcox.test",
                     correct=FALSE)+
  scale_color_manual(values=c("dodgerblue4", "red3"))+
  theme(legend.position="none")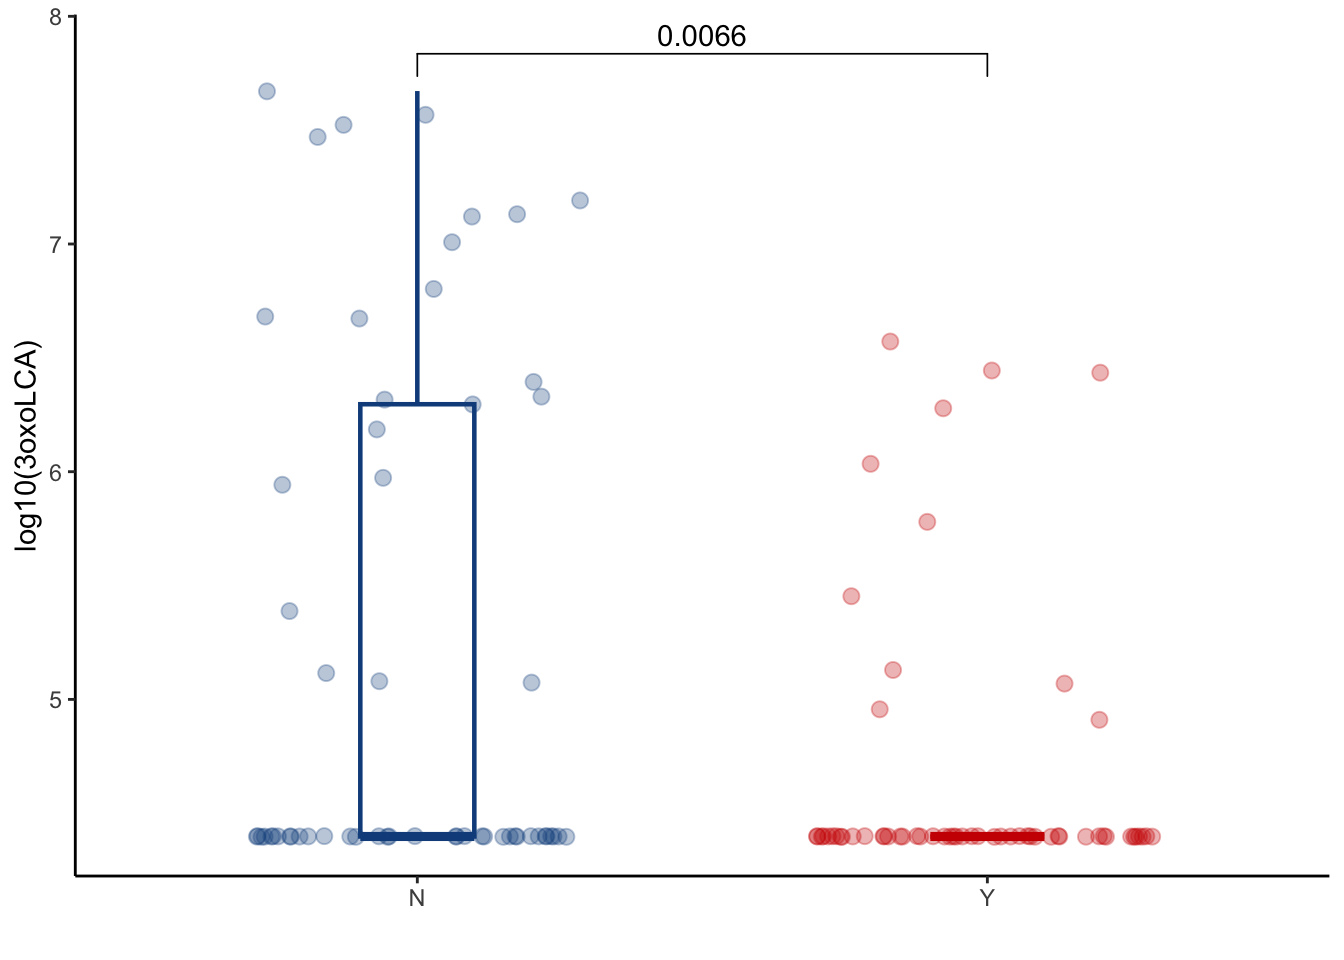
5.2 isoLCA
filtered_combined_table %>%
  left_join(cohort_BAS) %>%
  filter(later=="Y") %>%
  filter(ursodiol=="Y") %>%
  ggplot(aes(y=log10(isolithocholic_acid+25000), x=GI_GVHD, color=GI_GVHD))+
  geom_boxplot(width=0.2, lwd=0.8, outlier.shape = NA) +
  geom_jitter(width=0.3, alpha=0.3, size=2.5)+
  ylab("log10(isoLCA)")+
  xlab("")+
  theme_classic()+
  stat_compare_means(comparisons=list(c("Y", "N")),
                     method="wilcox.test",
                     correct=FALSE)+
  scale_color_manual(values=c("dodgerblue4", "red3"))+
  theme(legend.position="none")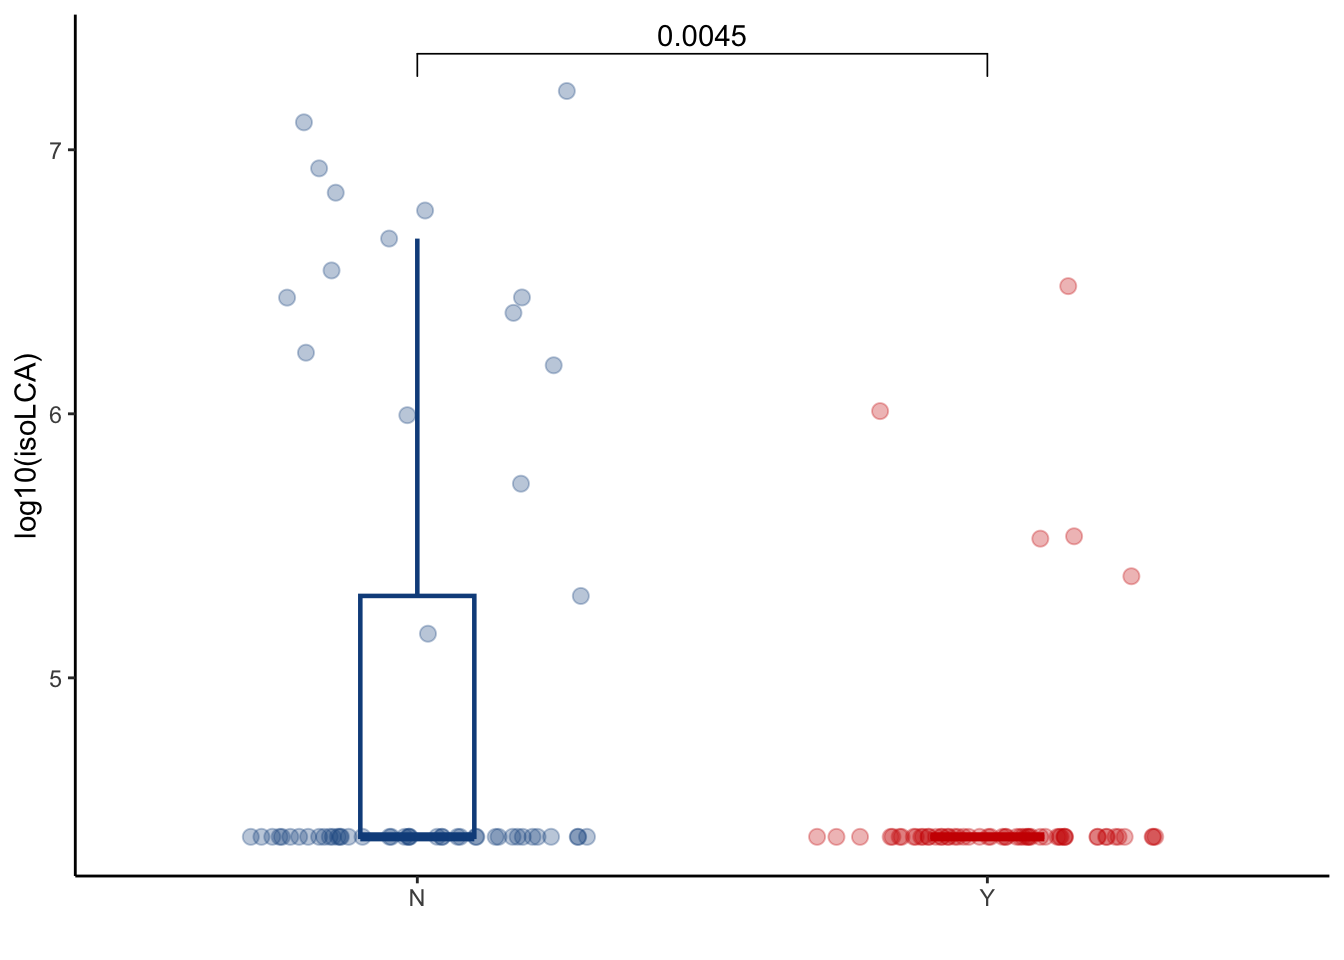
5.3 isoDCA
filtered_combined_table %>%
  left_join(cohort_BAS) %>%
  filter(later=="Y") %>%
  filter(ursodiol=="Y") %>%
  ggplot(aes(y=log10(isodeoxycholic_acid+25000), x=GI_GVHD, color=GI_GVHD))+
  geom_boxplot(width=0.2, lwd=0.8, outlier.shape = NA) +
  geom_jitter(width=0.3, alpha=0.3, size=2.5)+
  ylab("log10(isoDCA)")+
  xlab("")+
  theme_classic()+
  stat_compare_means(comparisons=list(c("Y", "N")),
                     method="wilcox.test",
                     correct=FALSE)+
  scale_color_manual(values=c("dodgerblue4", "red3"))+
  theme(legend.position="none")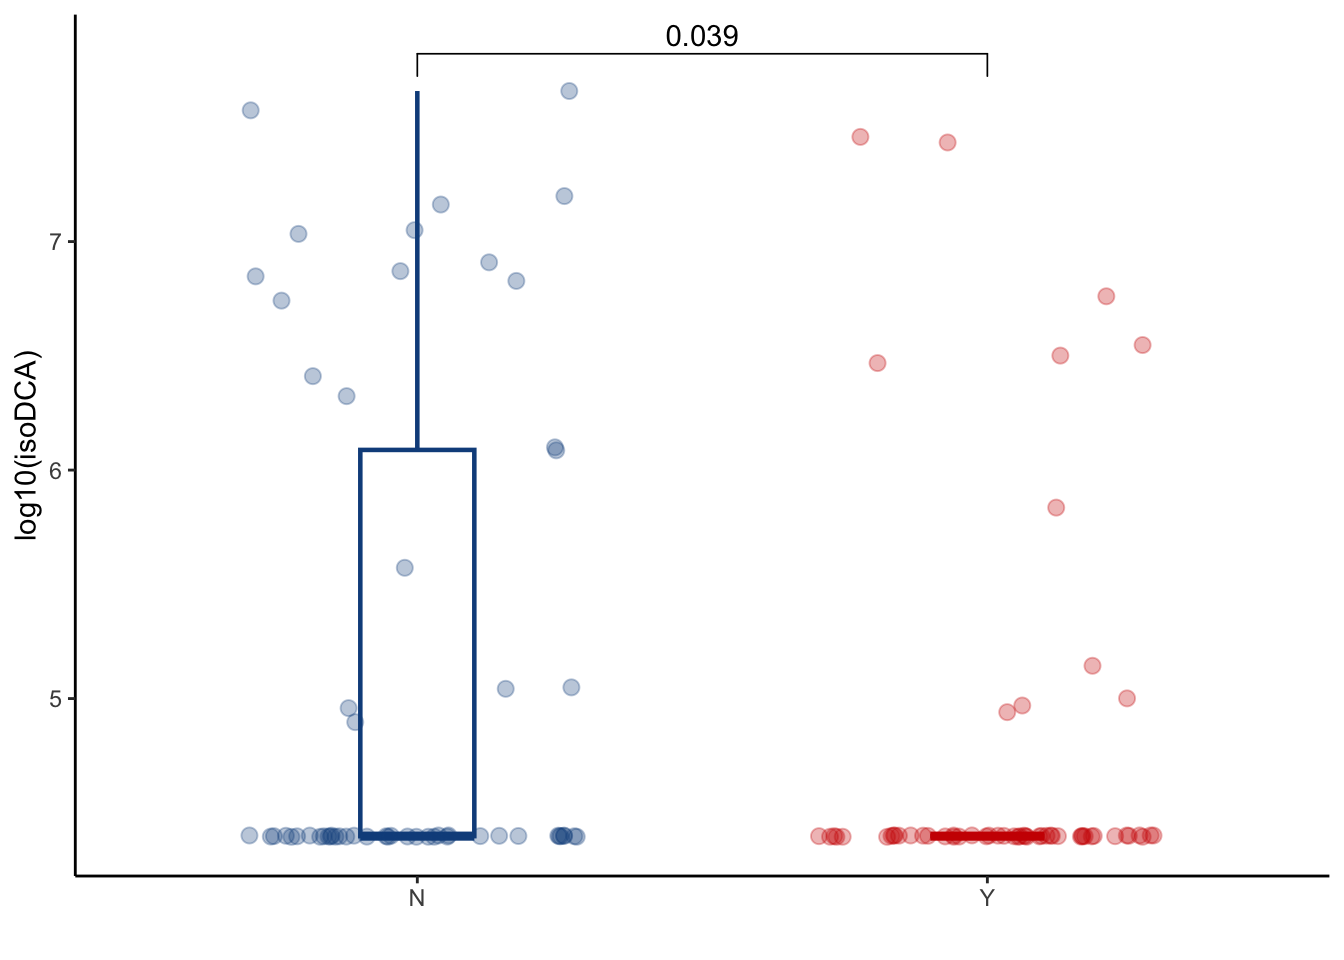
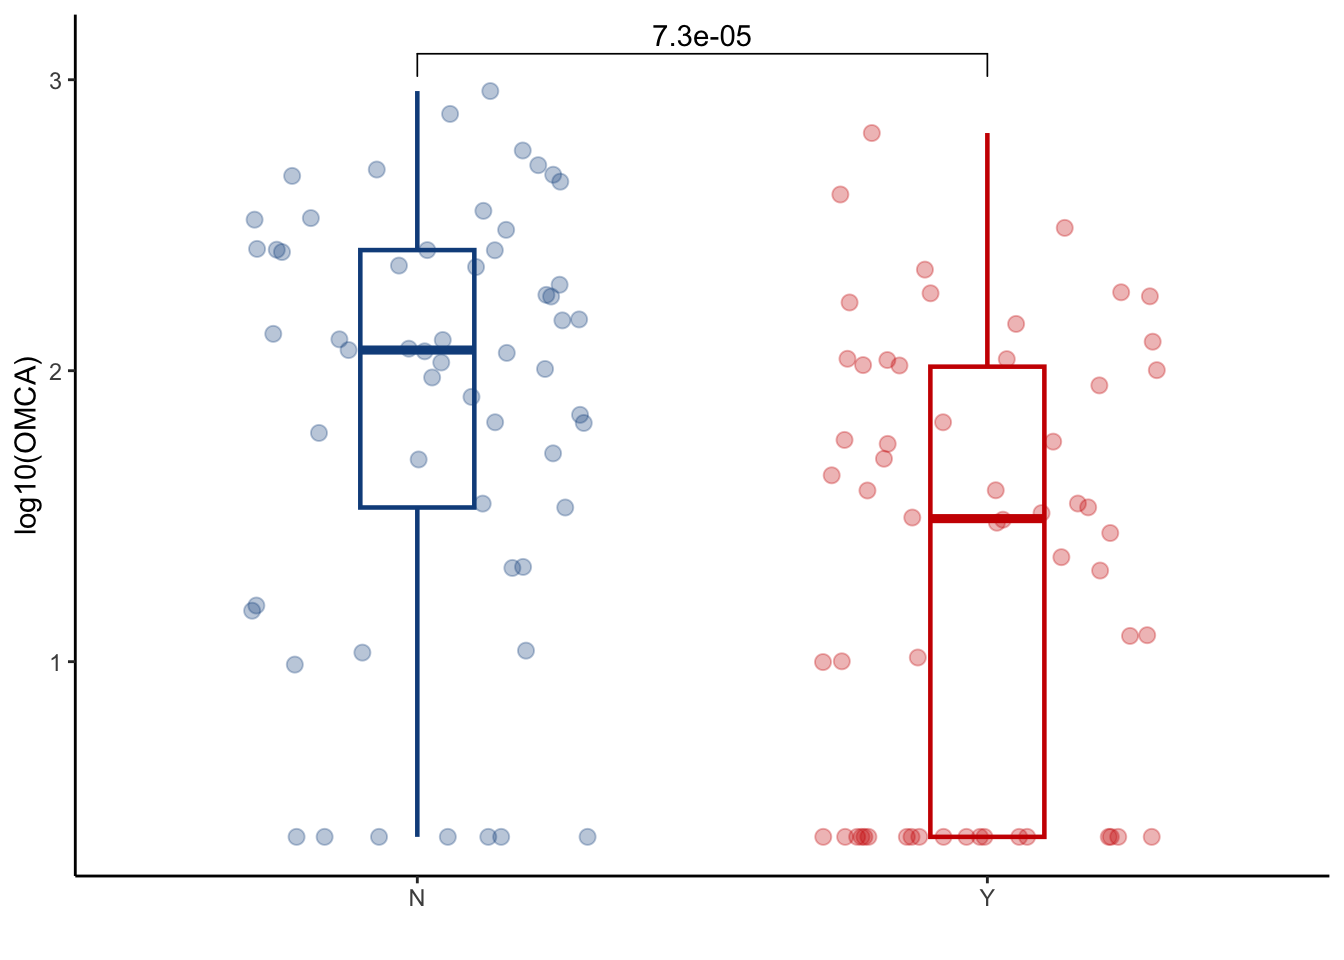
5.4 OMCA
conc_all_filtered %>%
  left_join(cohort_BAS) %>%
  filter(later=="Y") %>%
  filter(ursodiol=="Y") %>%
  ggplot(aes(y=log10(omega_muricholic_acid+2.5), x=GI_GVHD, color=GI_GVHD))+
  geom_boxplot(width=0.2, lwd=0.8, outlier.shape = NA) +
  geom_jitter(width=0.3, alpha=0.3, size=2.5)+
  ylab("log10(OMCA)")+
  xlab("")+
  theme_classic()+
  stat_compare_means(comparisons=list(c("Y", "N")),
                     method="wilcox.test",
                     correct=FALSE)+
  scale_color_manual(values=c("dodgerblue4", "red3"))+
  theme(legend.position="none")